Public beta opens May 3, 2027
A feature-rich trading platform for futures traders: a full-featured DOM, footprint, TPO, volume profile and liquidity heatmap, visual study scripting, and a market simulator built on a live order book.
What sets it apart
Visual scripting
A visual scripting environment for building, inspecting and running indicators, inside the same app you trade from.
Every study on your desk appears as a node, connected by the data it reads. Add functions from a library of building blocks, connect them, and deploy with Save And Run. Each node reports its own processing cost as it runs, so you can see exactly what every chart is spending.
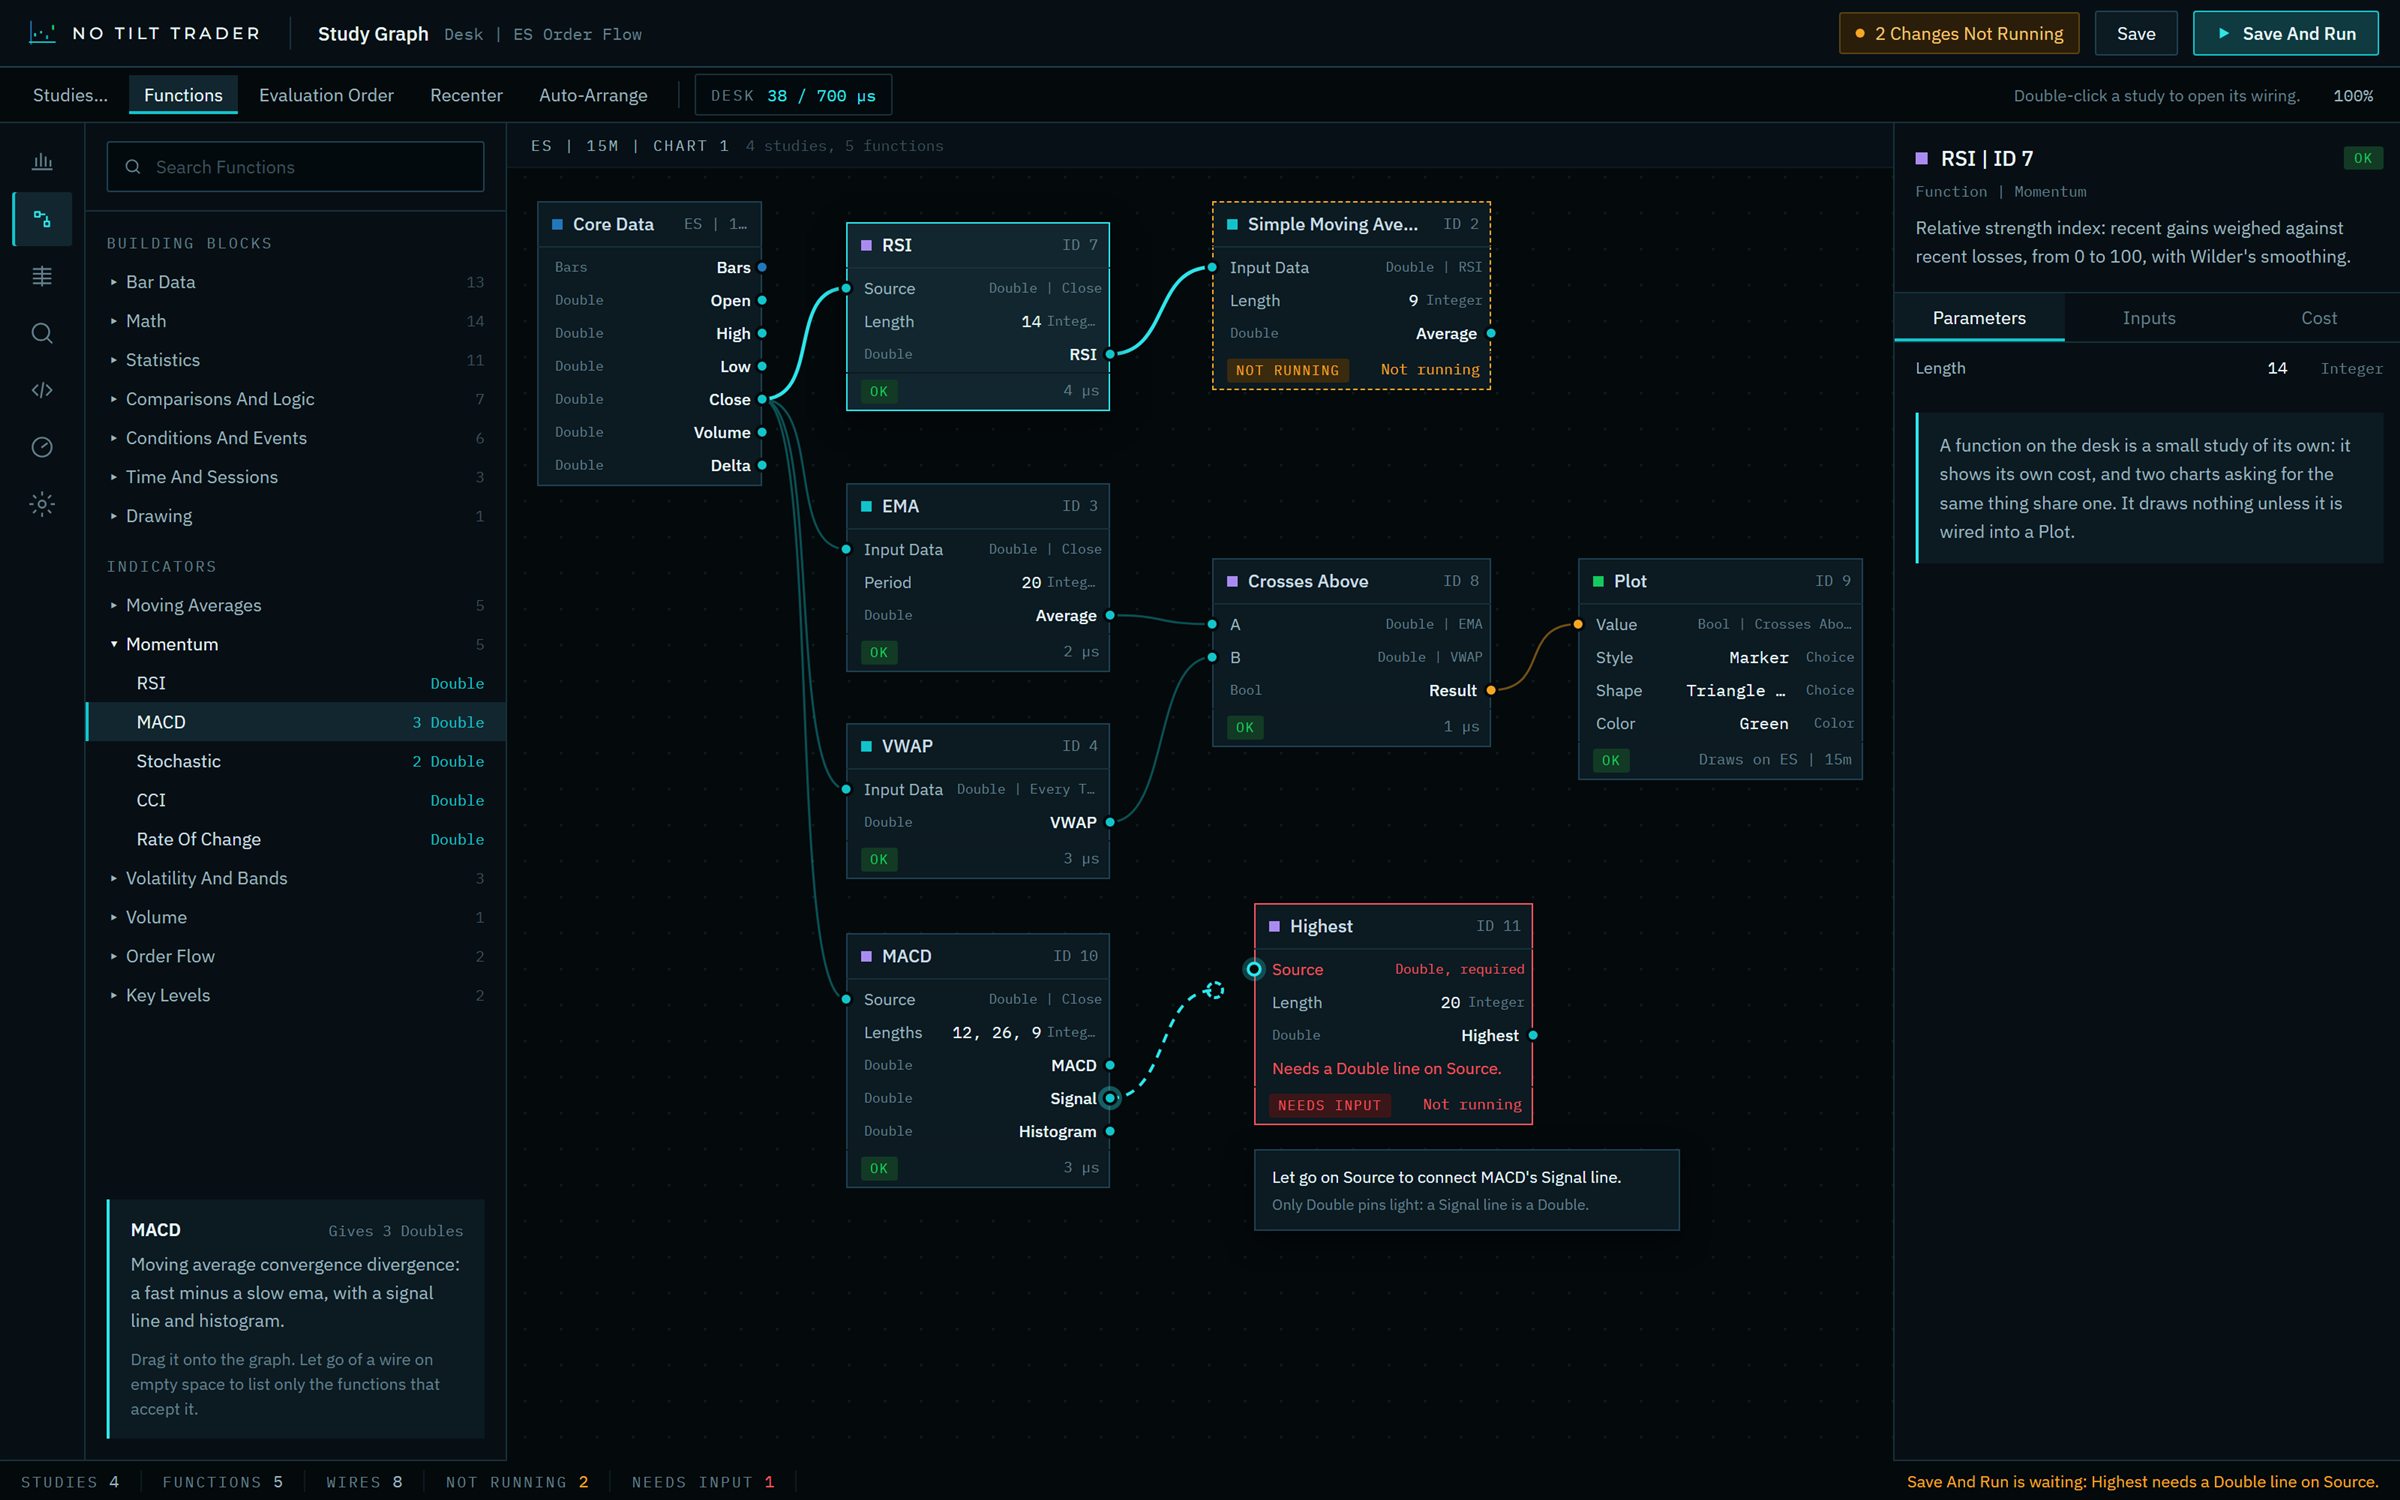
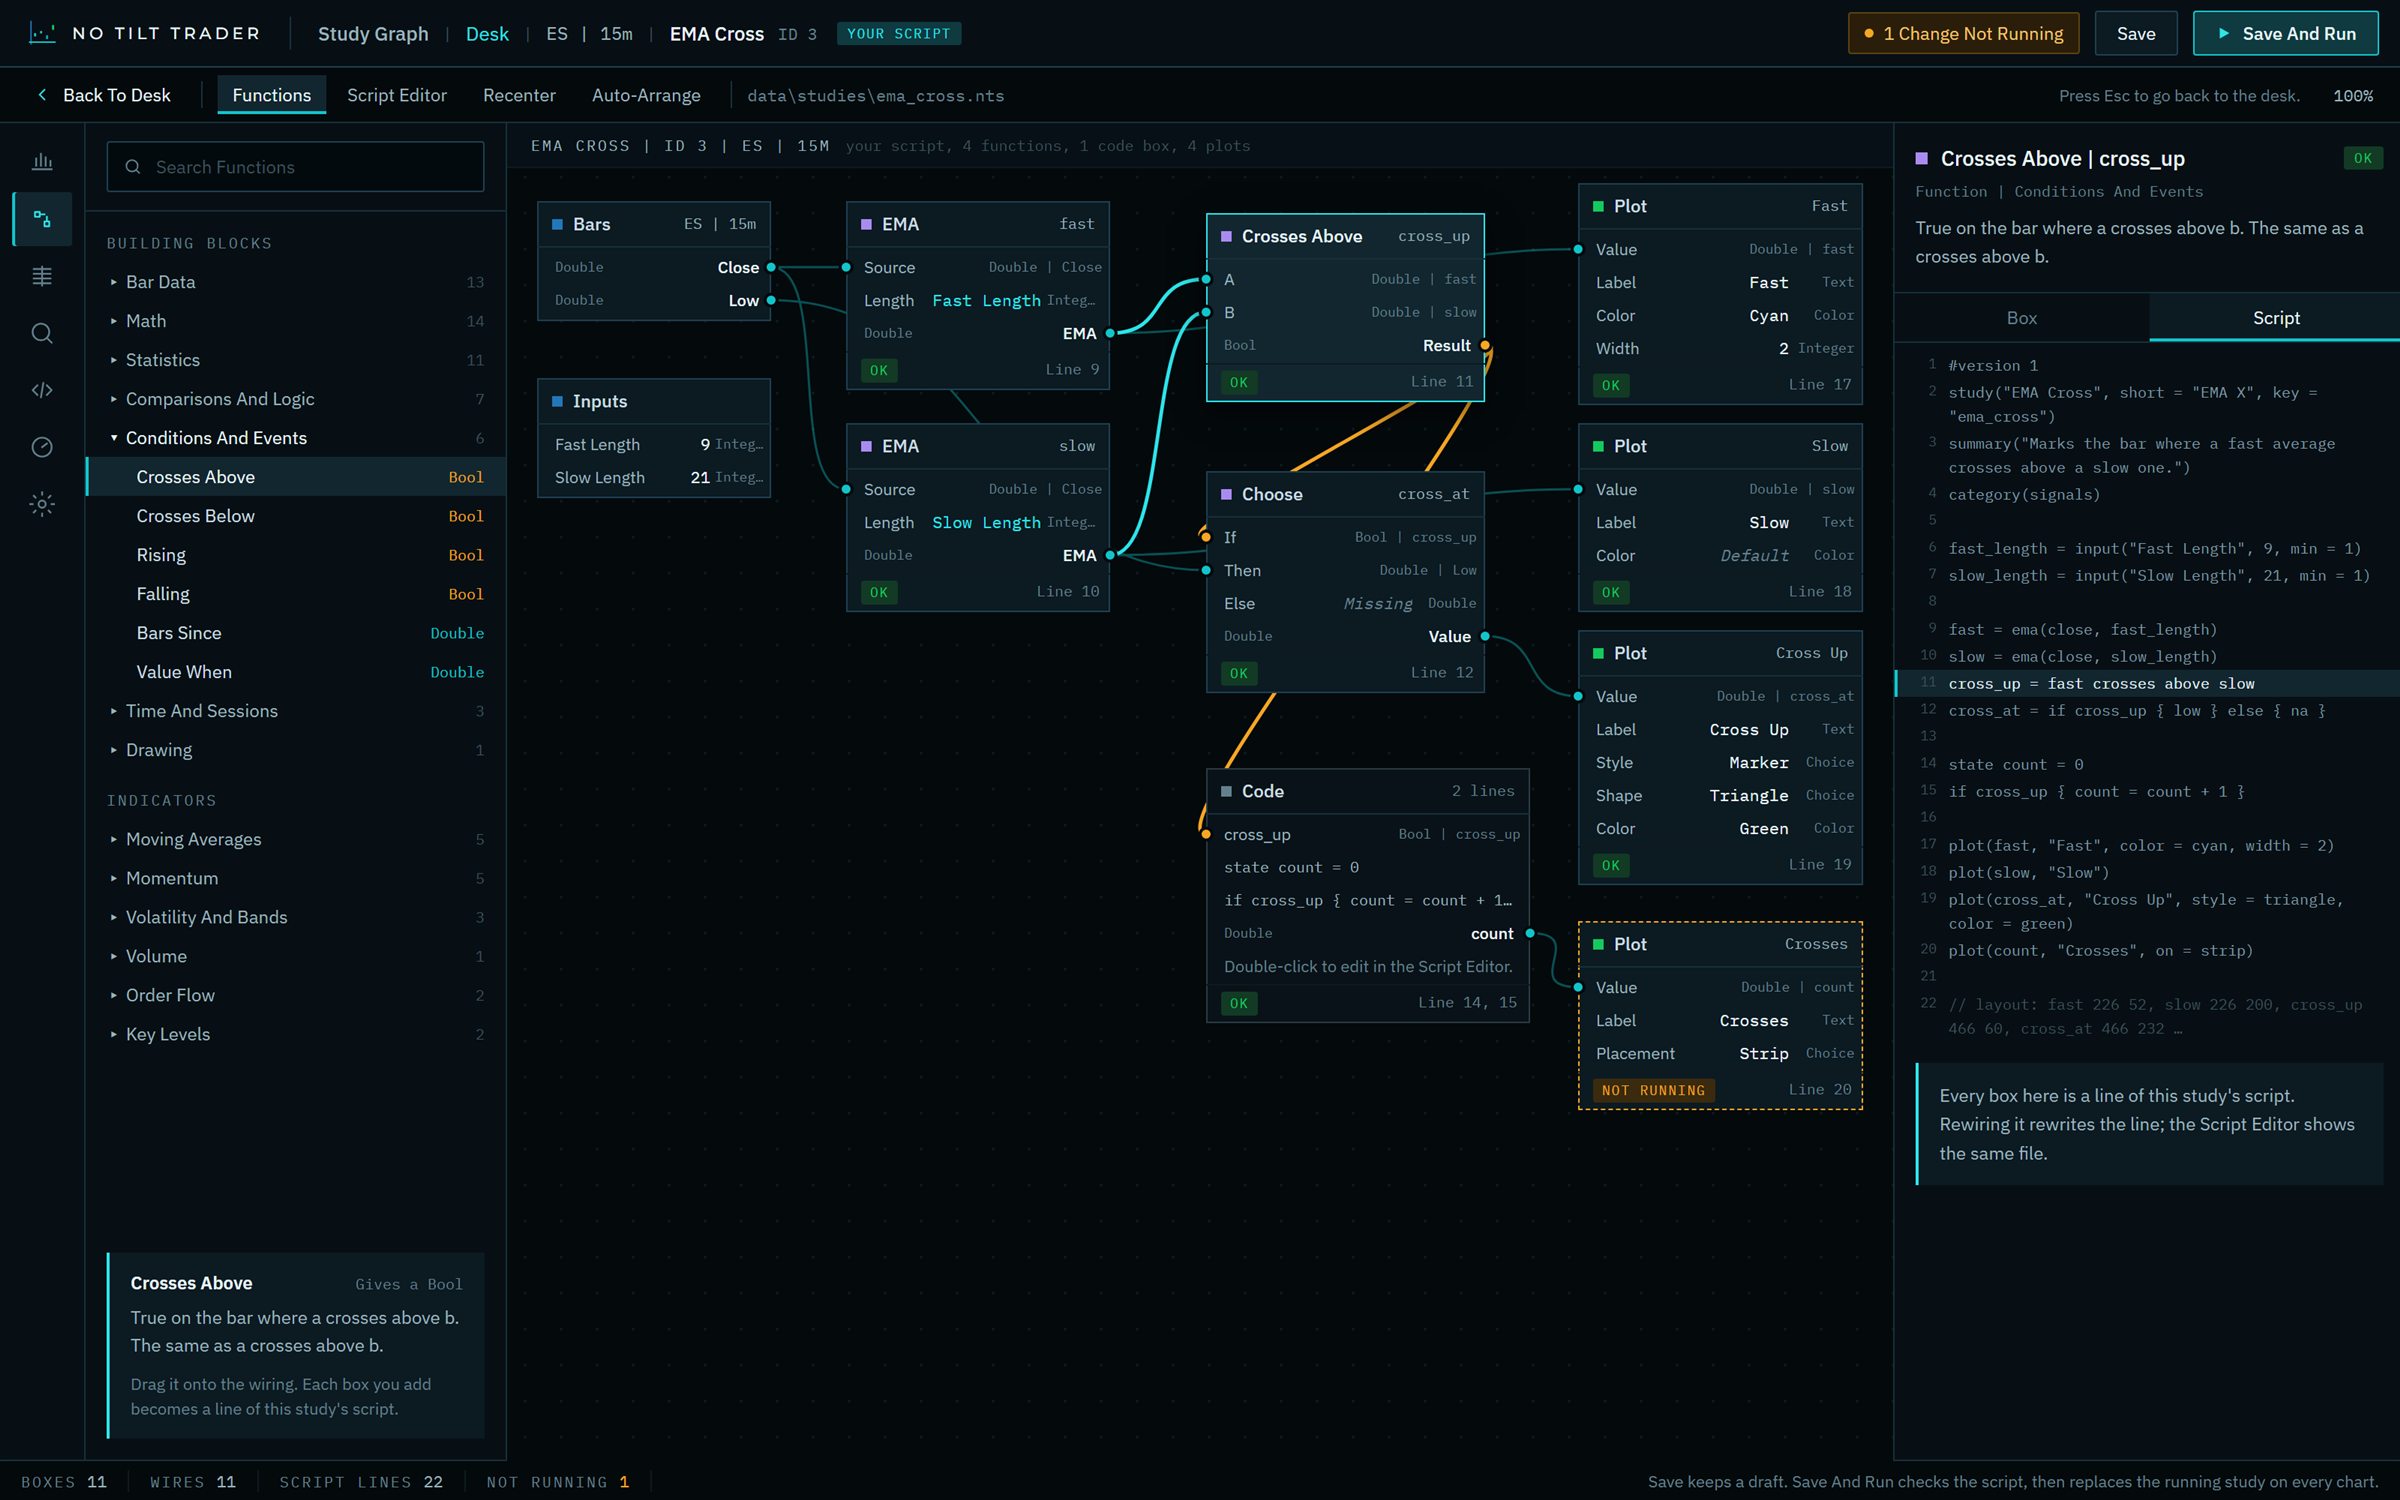
Every study can be edited as a node graph or as code. Changes made in the graph are written straight into the script, and edits to the script redraw the graph, so the two never drift apart.
Market simulator
The simulator is not a replay with your fills pasted on top. It's a live order book full of simulated market makers, trend followers, value traders and institutions. Your orders join the queue, wait their turn, and move price when they're big enough to.
The same five sliders as the app's Simulator Manager. Each market keeps its own mix.
Generate anything from a single session to a full trading year of new market data. Every session is built fresh, with realistic intraday volatility and a full overnight session.
Start from real CME contracts, with five at launch and more added over time. The generator builds a market that trades like the one you choose.
Guided sessions follow a predefined market plan. Free sessions are driven entirely by the simulated participants. Hybrid plays a predefined history, then hands the market to the participants from the current session on.
Create as many simulated accounts as you need, each with its own balance and margin requirements. An account that breaches its limits is locked to new entries, as it would be at a broker.
Order flow
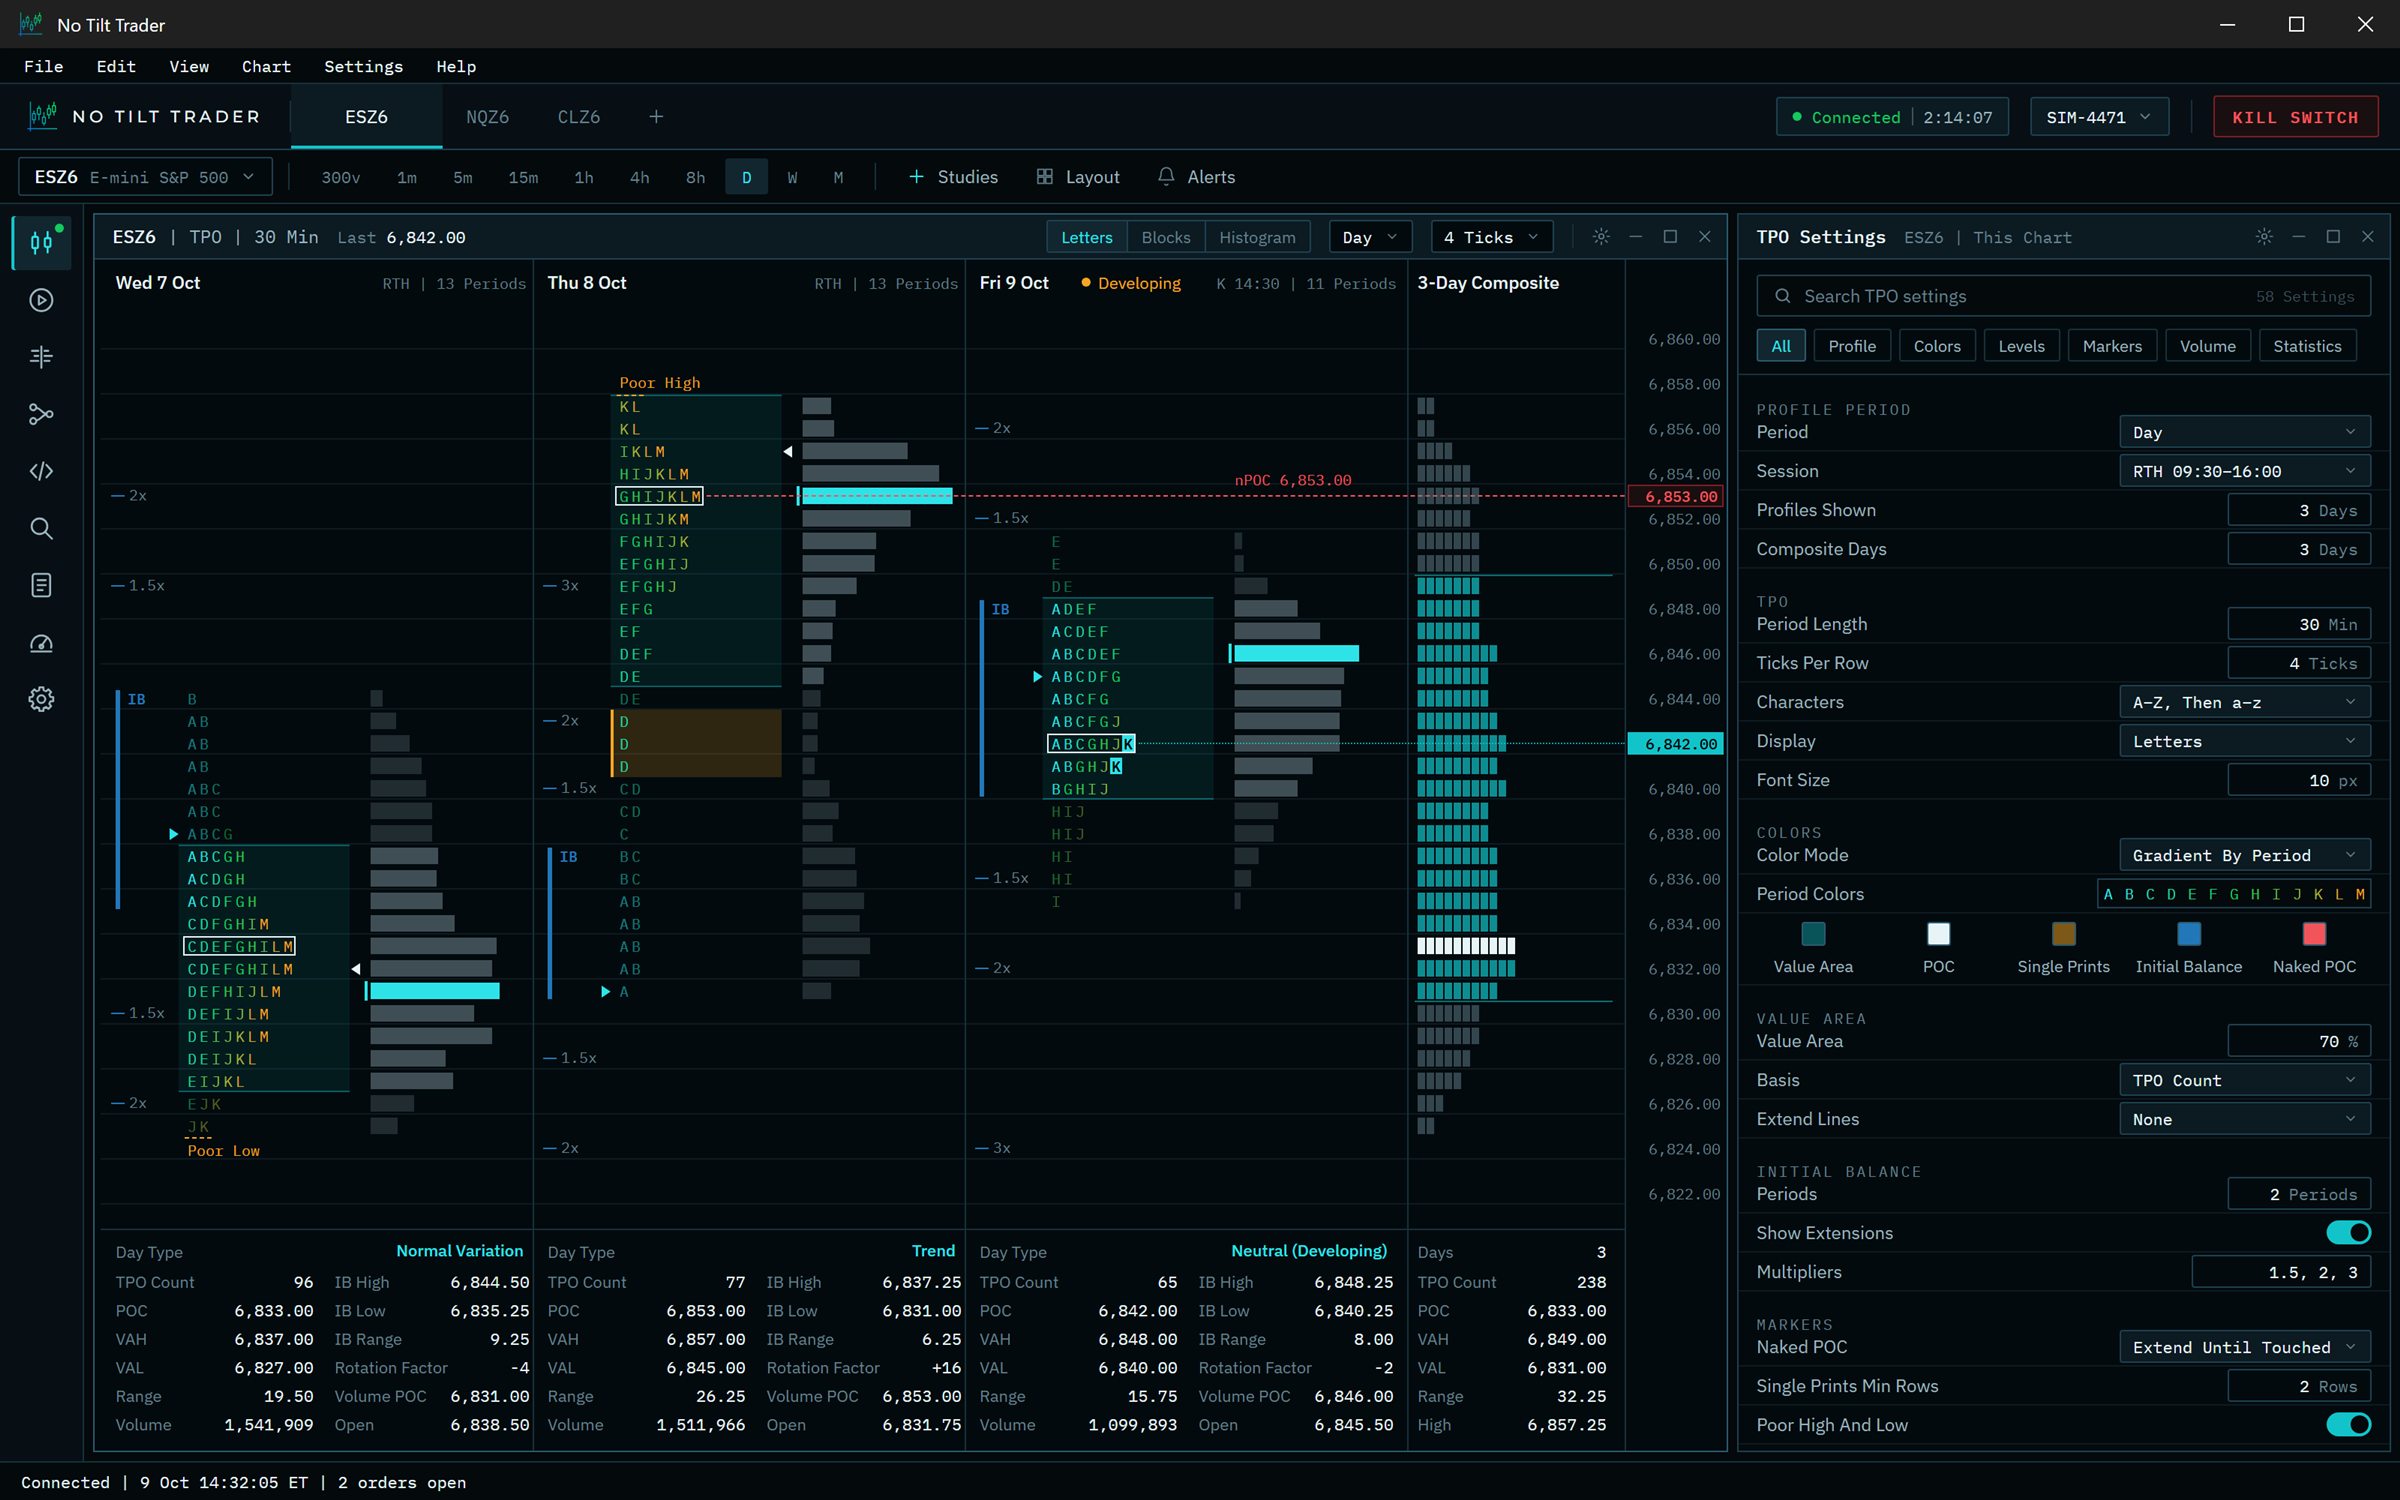
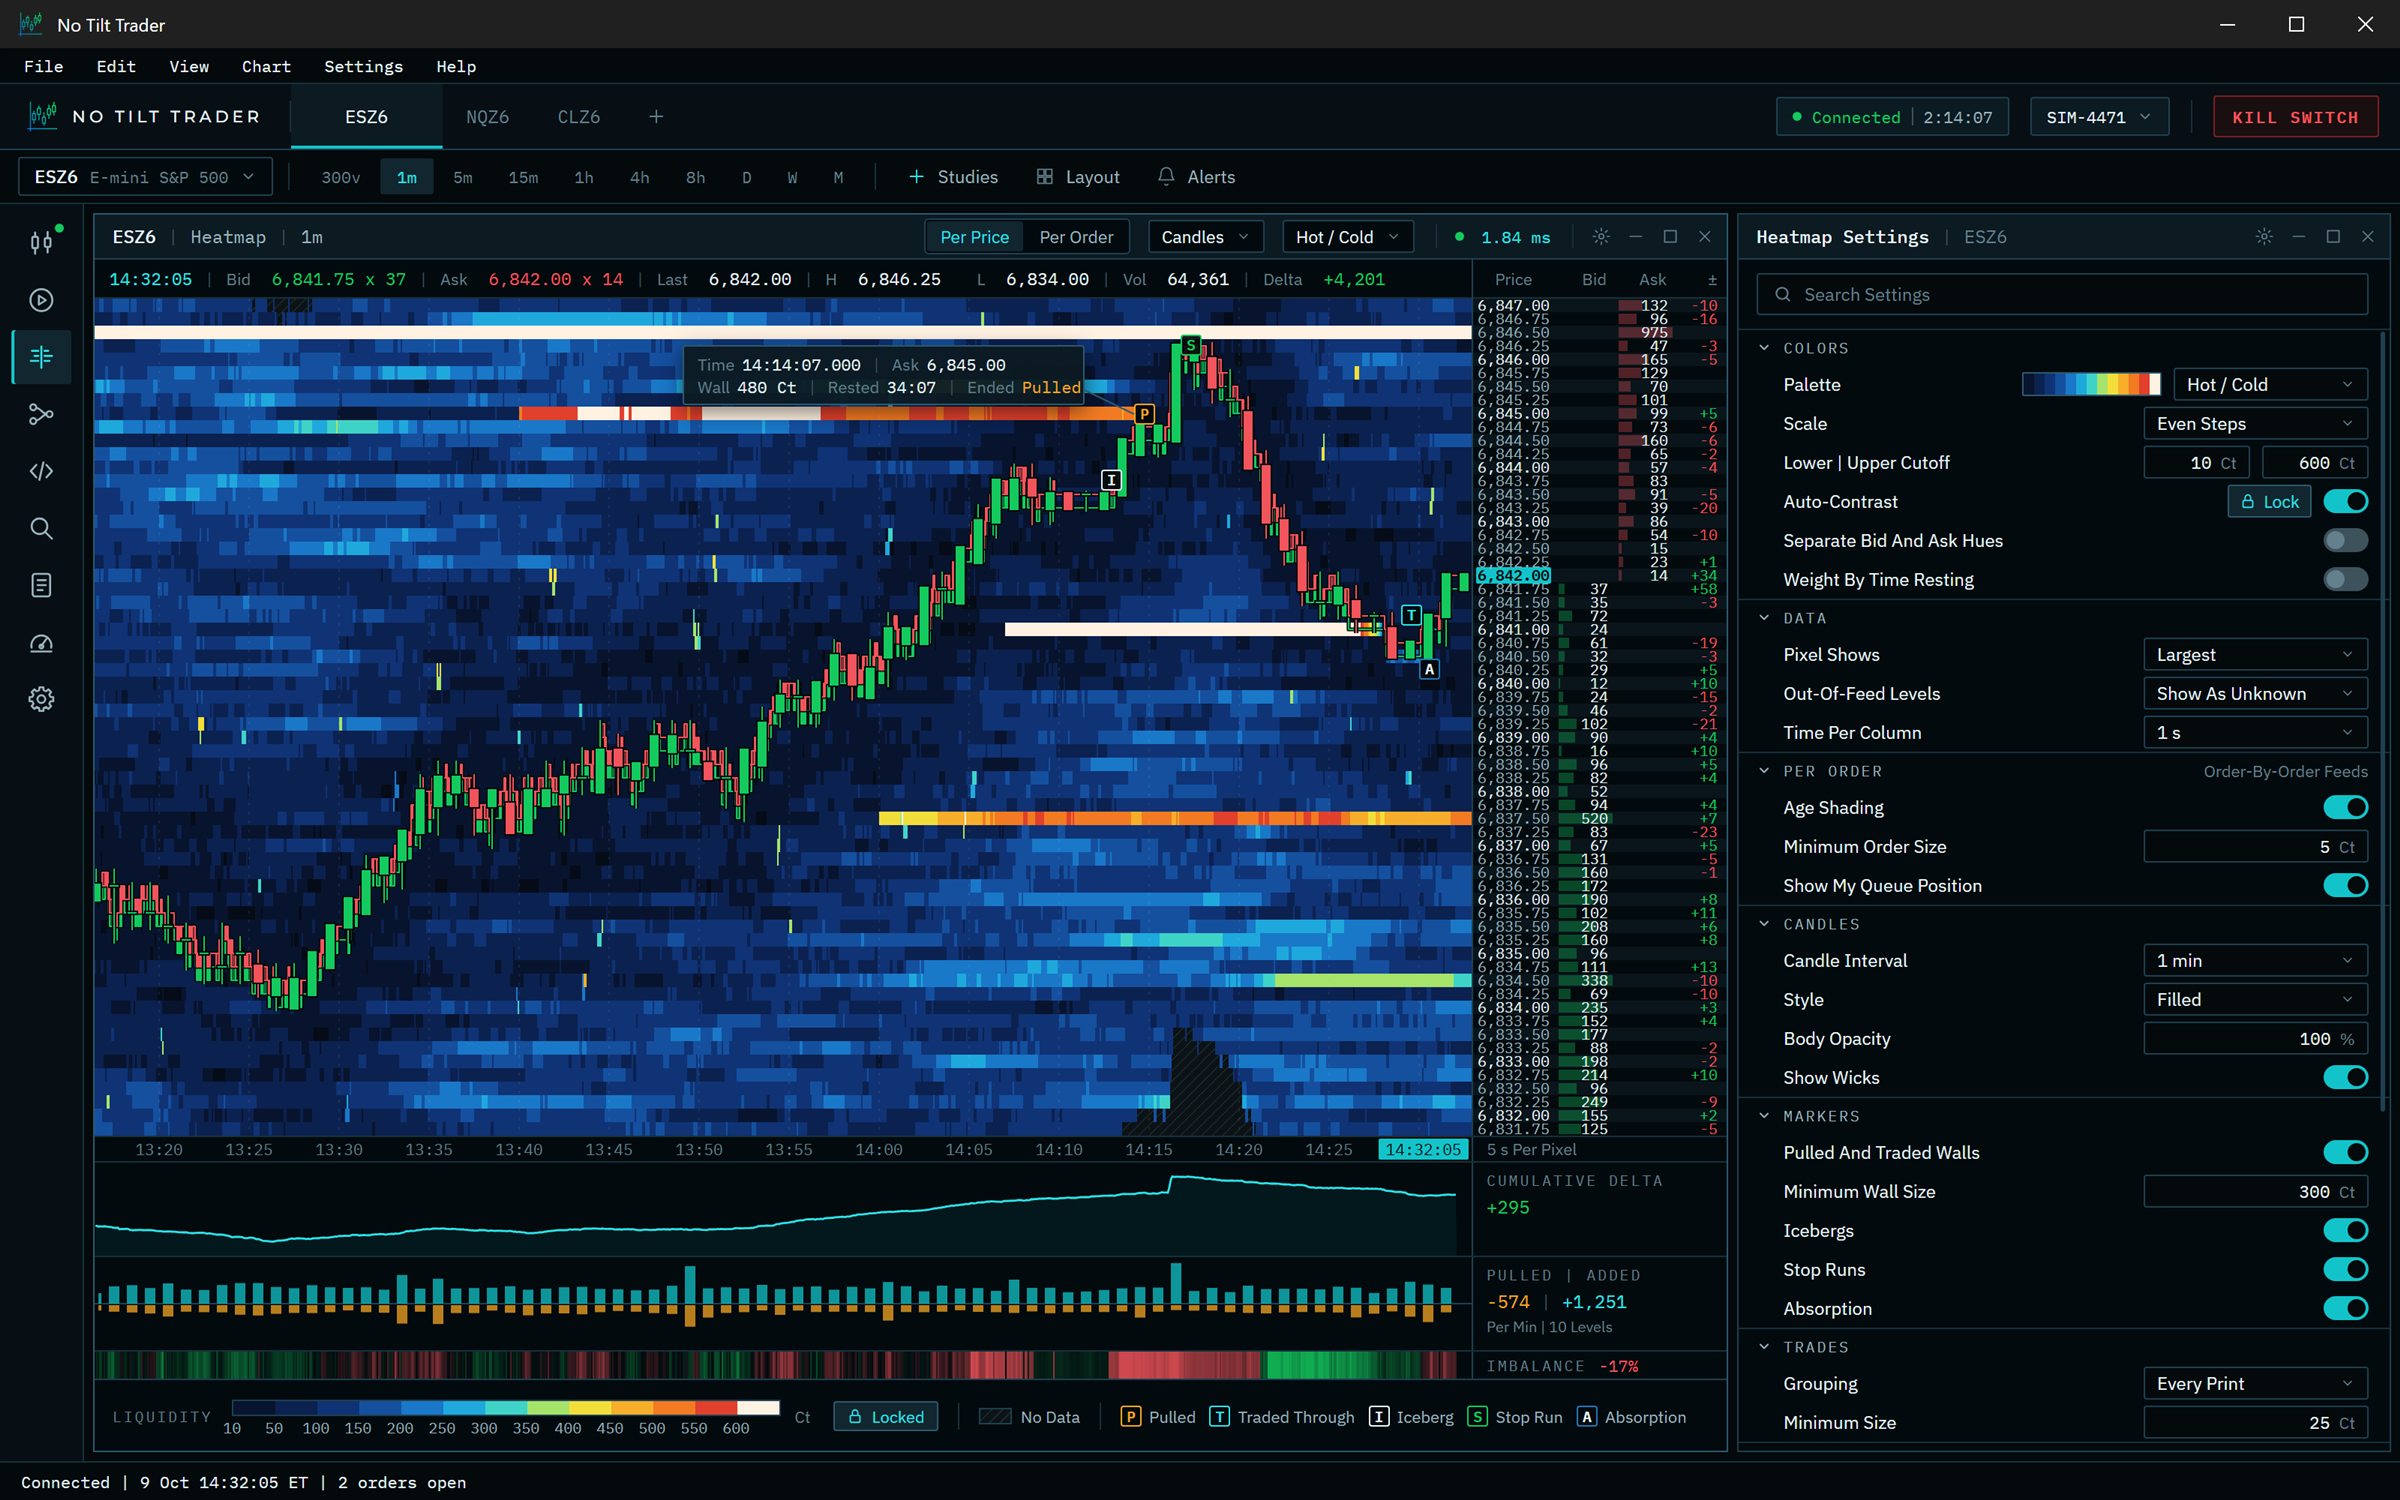
DOM, footprint, TPO, volume profile and liquidity heatmap, built on the same market data and the same timeline, with the depth of configuration active futures traders expect.
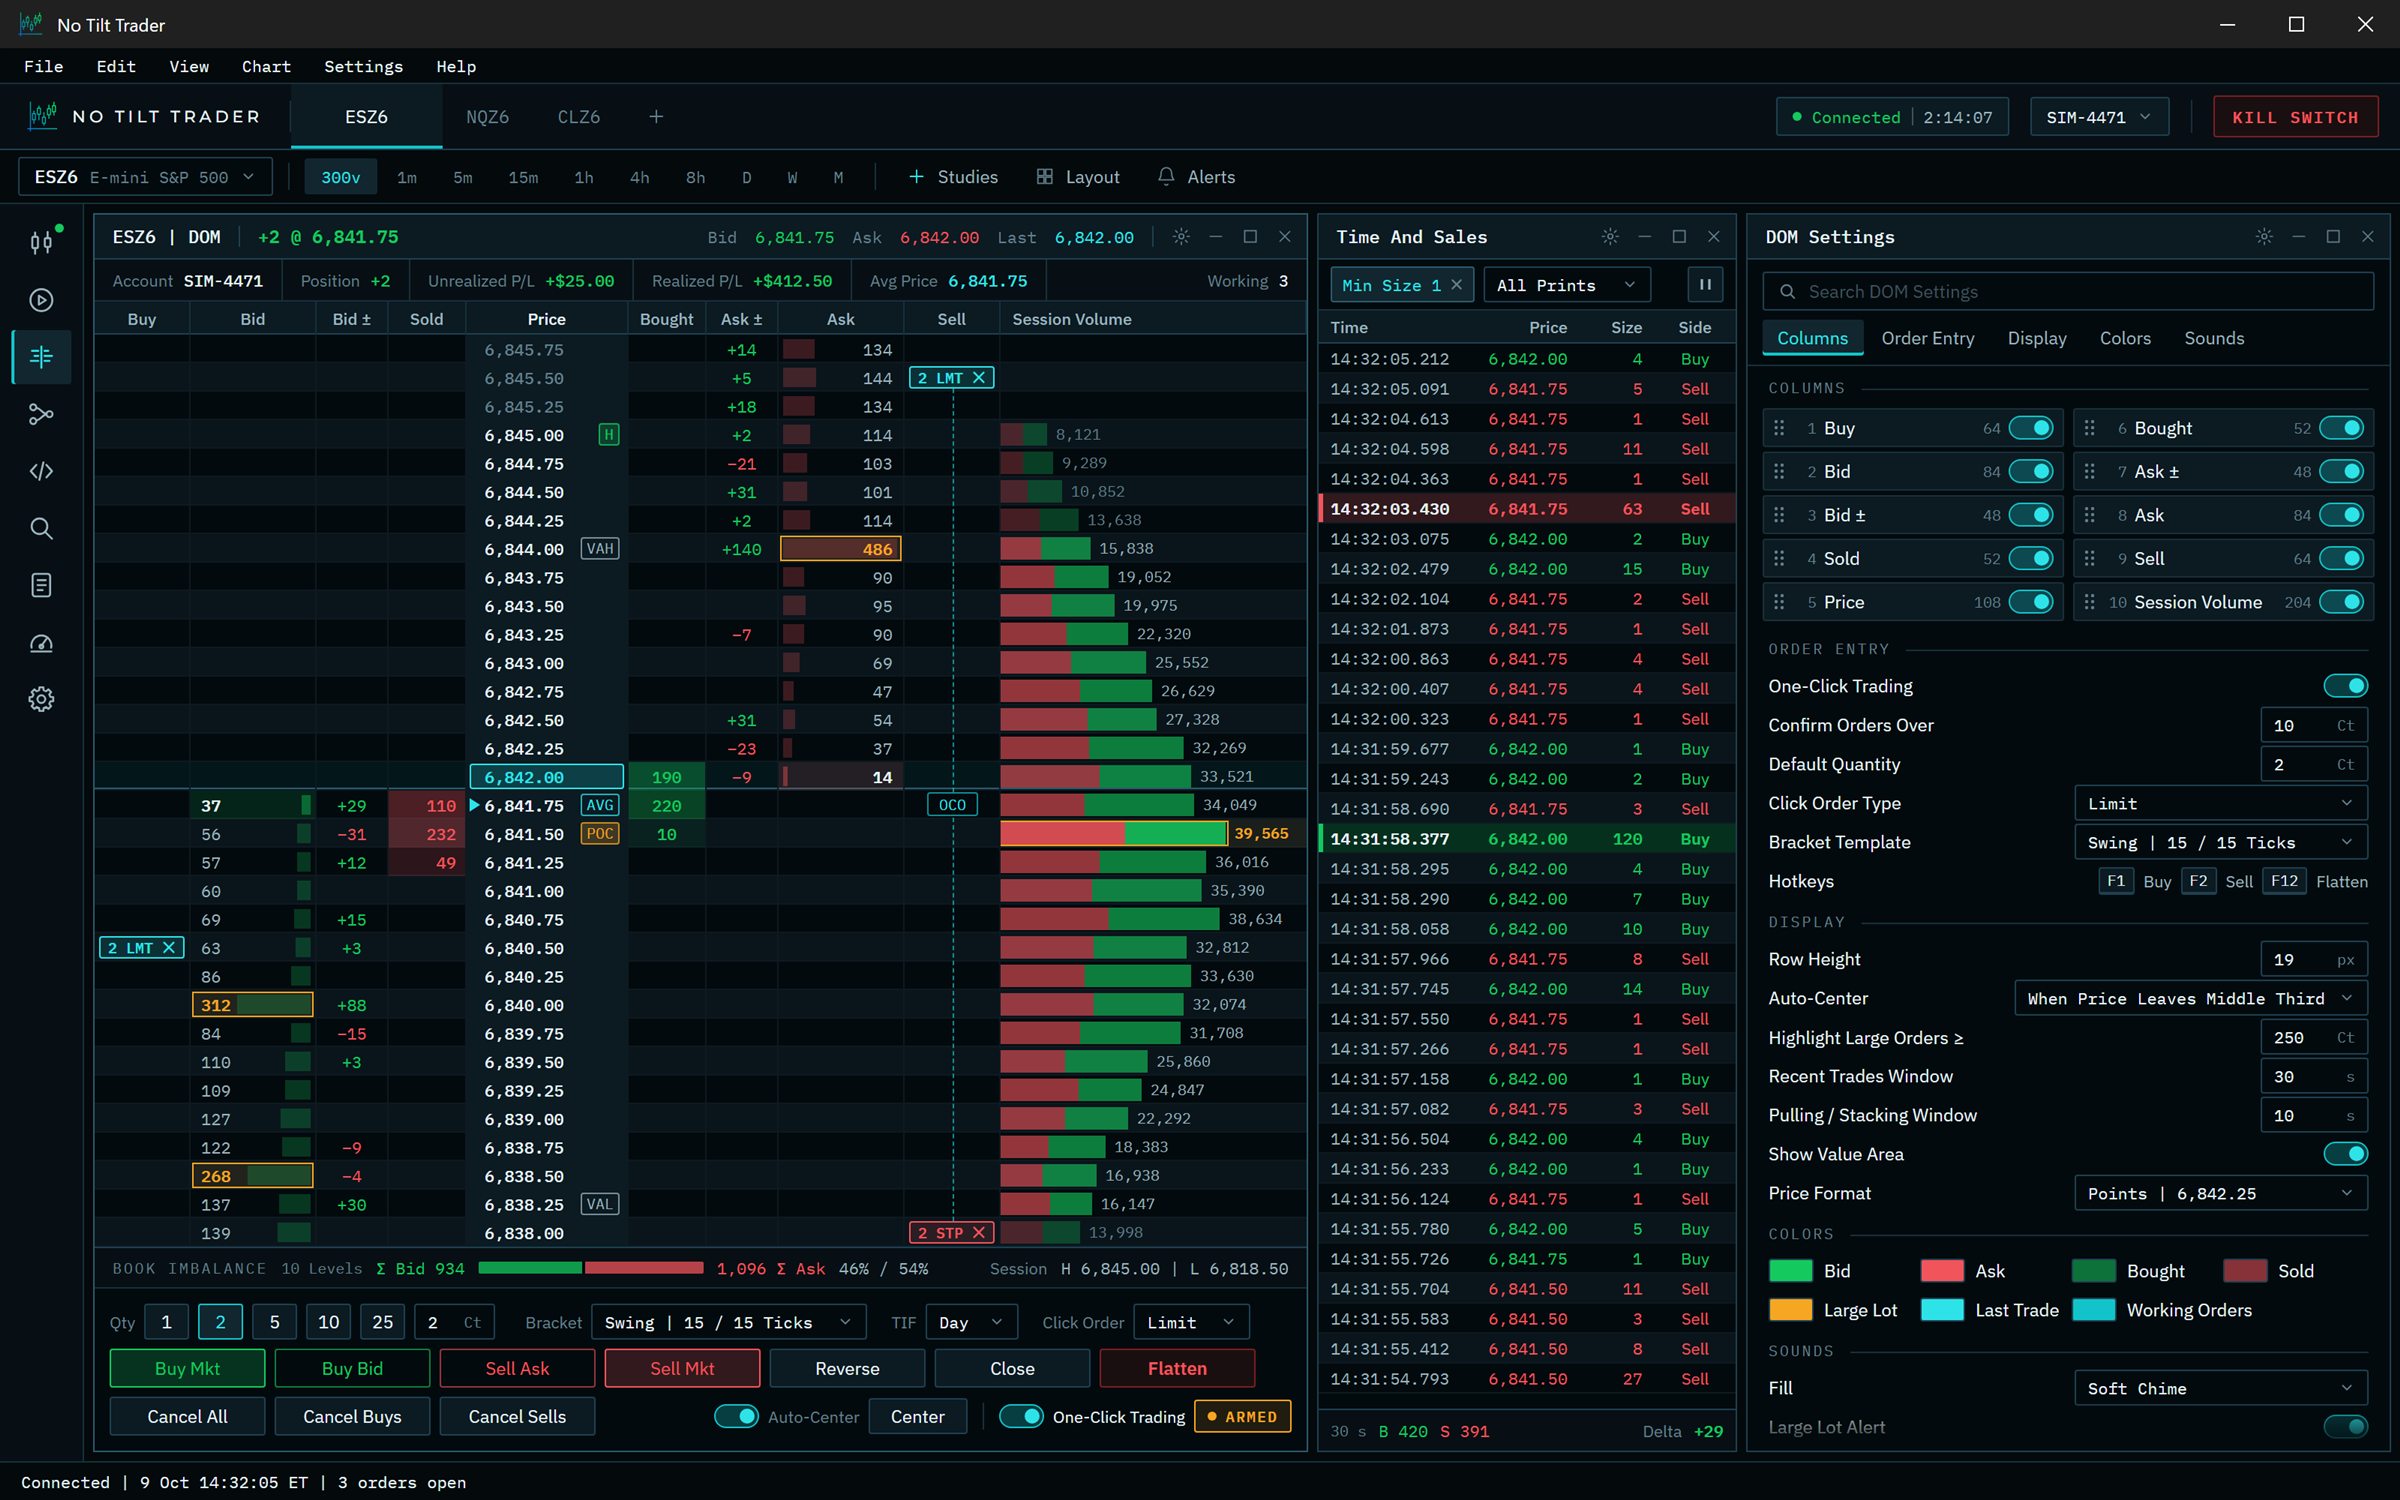
Bid and ask depth, pulling and stacking, volume traded at the bid and offer, and session volume at price on a single ladder, with full order entry.
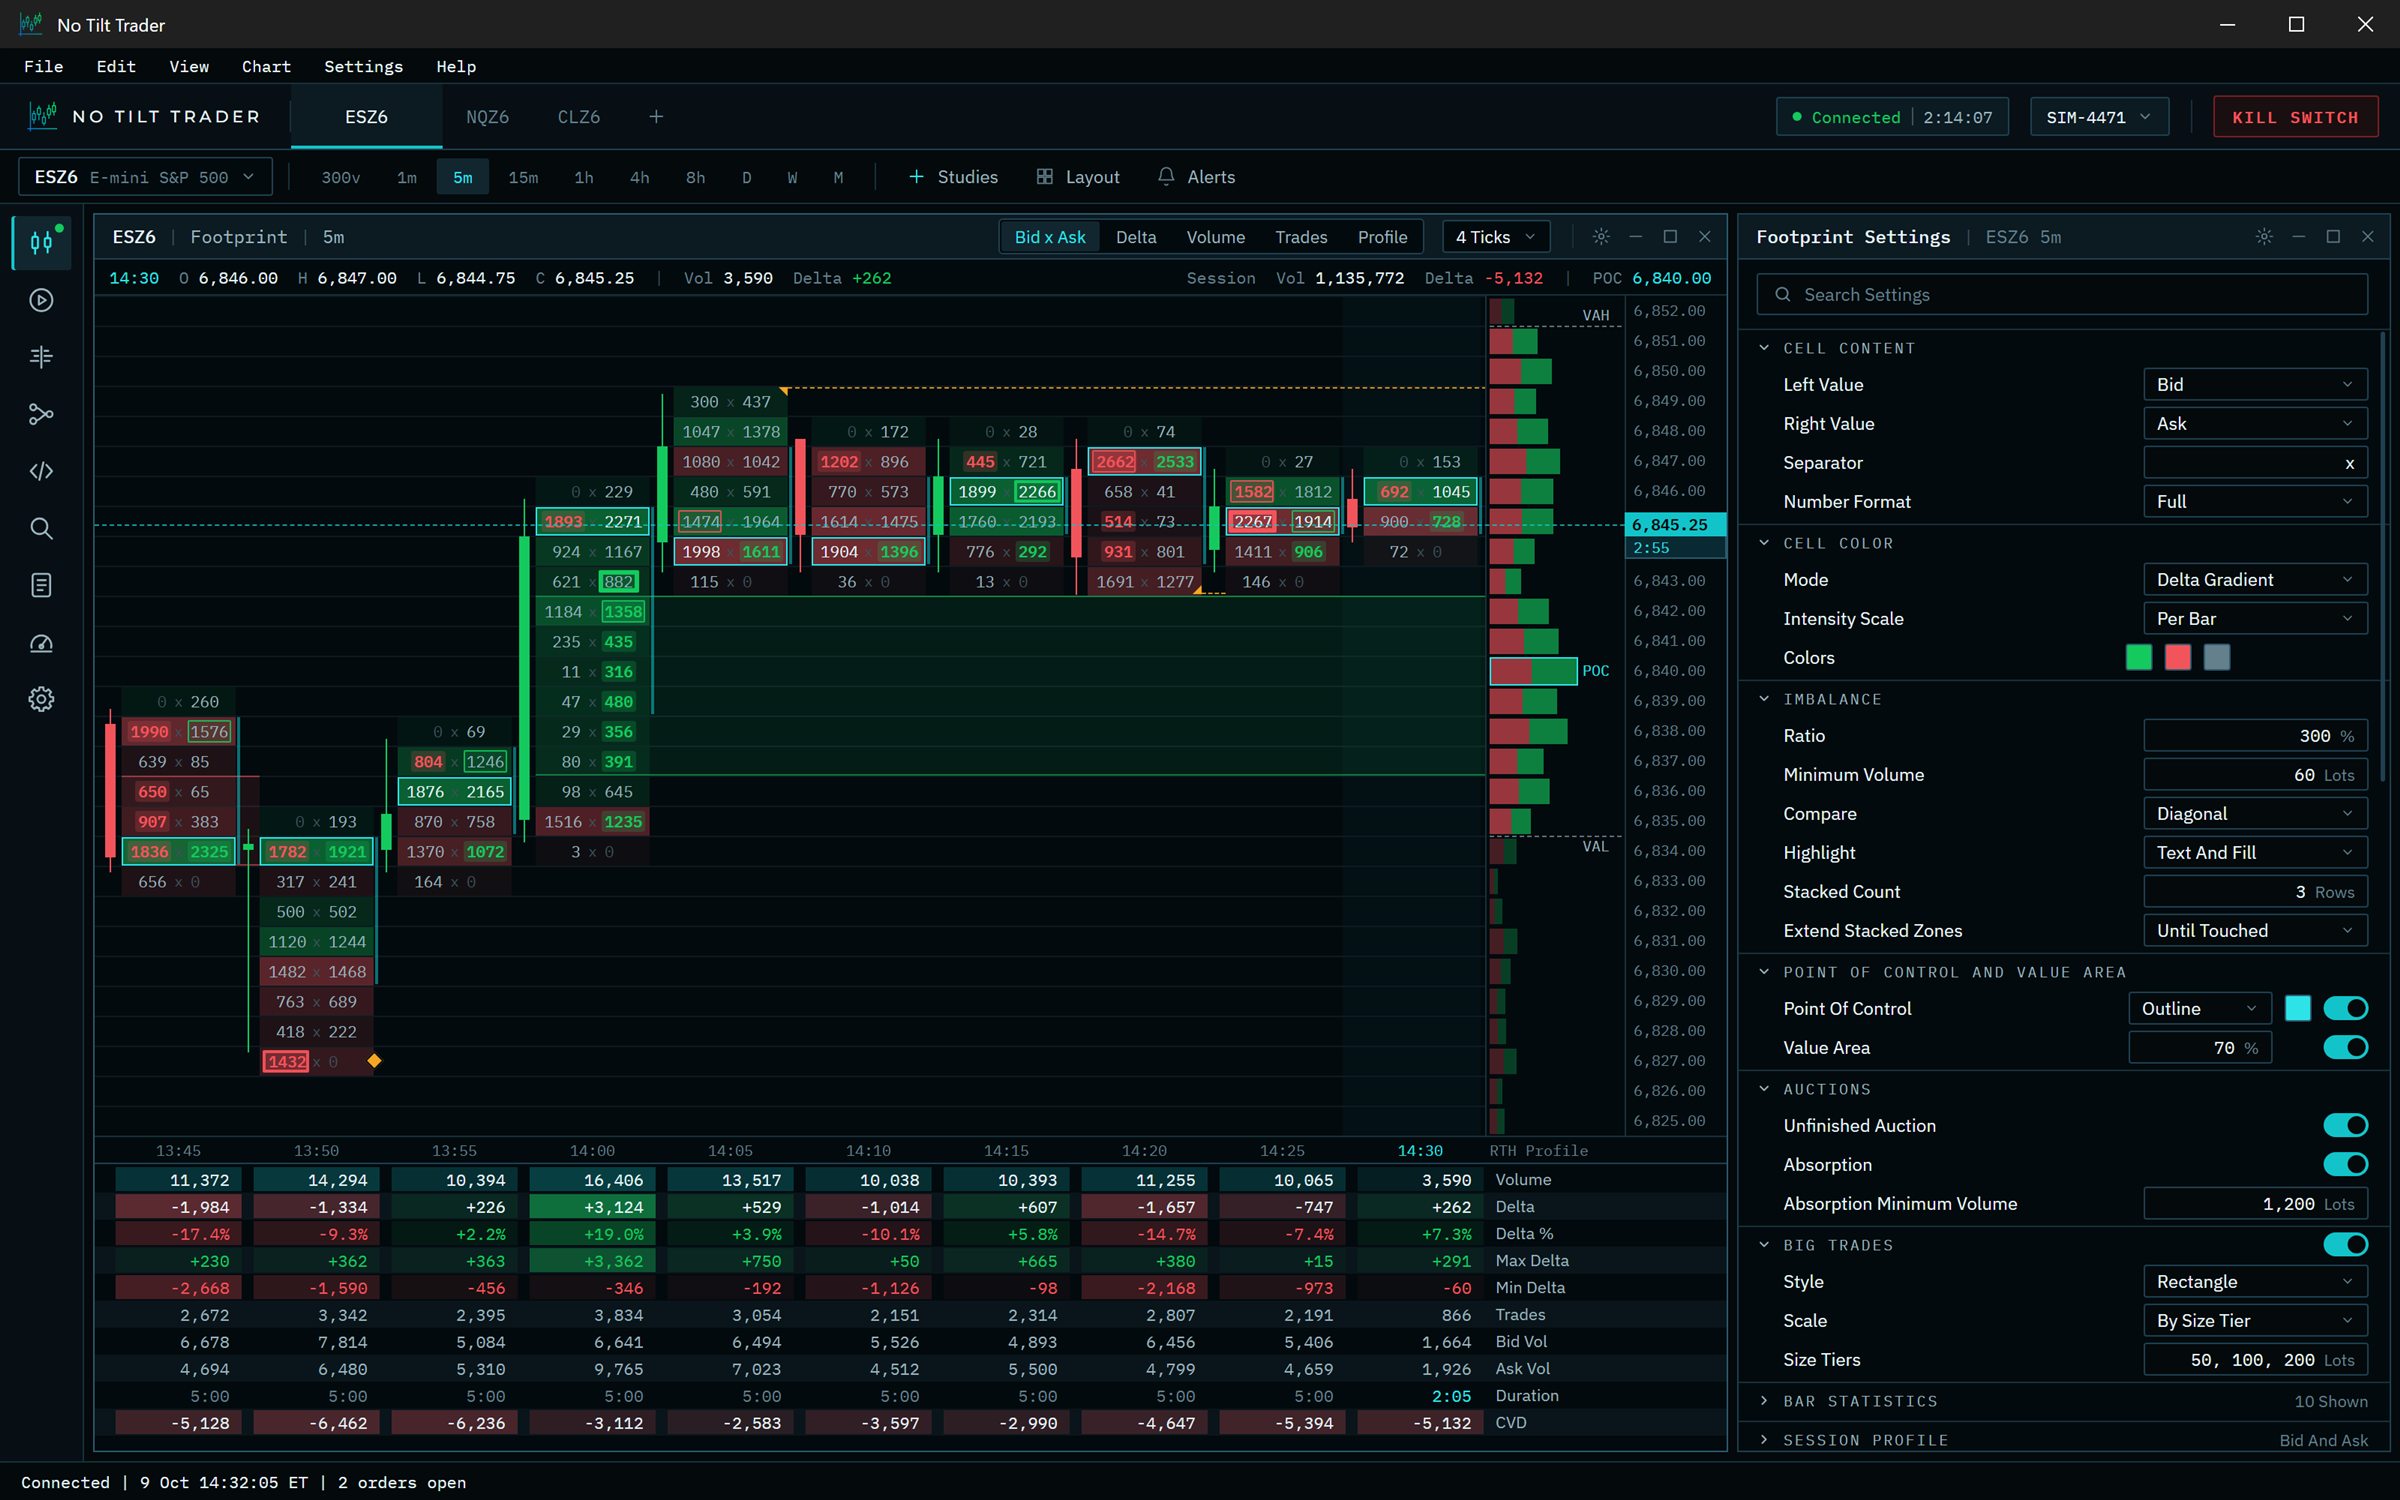
Bid and ask volume at every price in every bar, shaded by delta, with each bar's point of control and value area.
Time at price by 30-minute period for every session, with value area, point of control and initial balance.
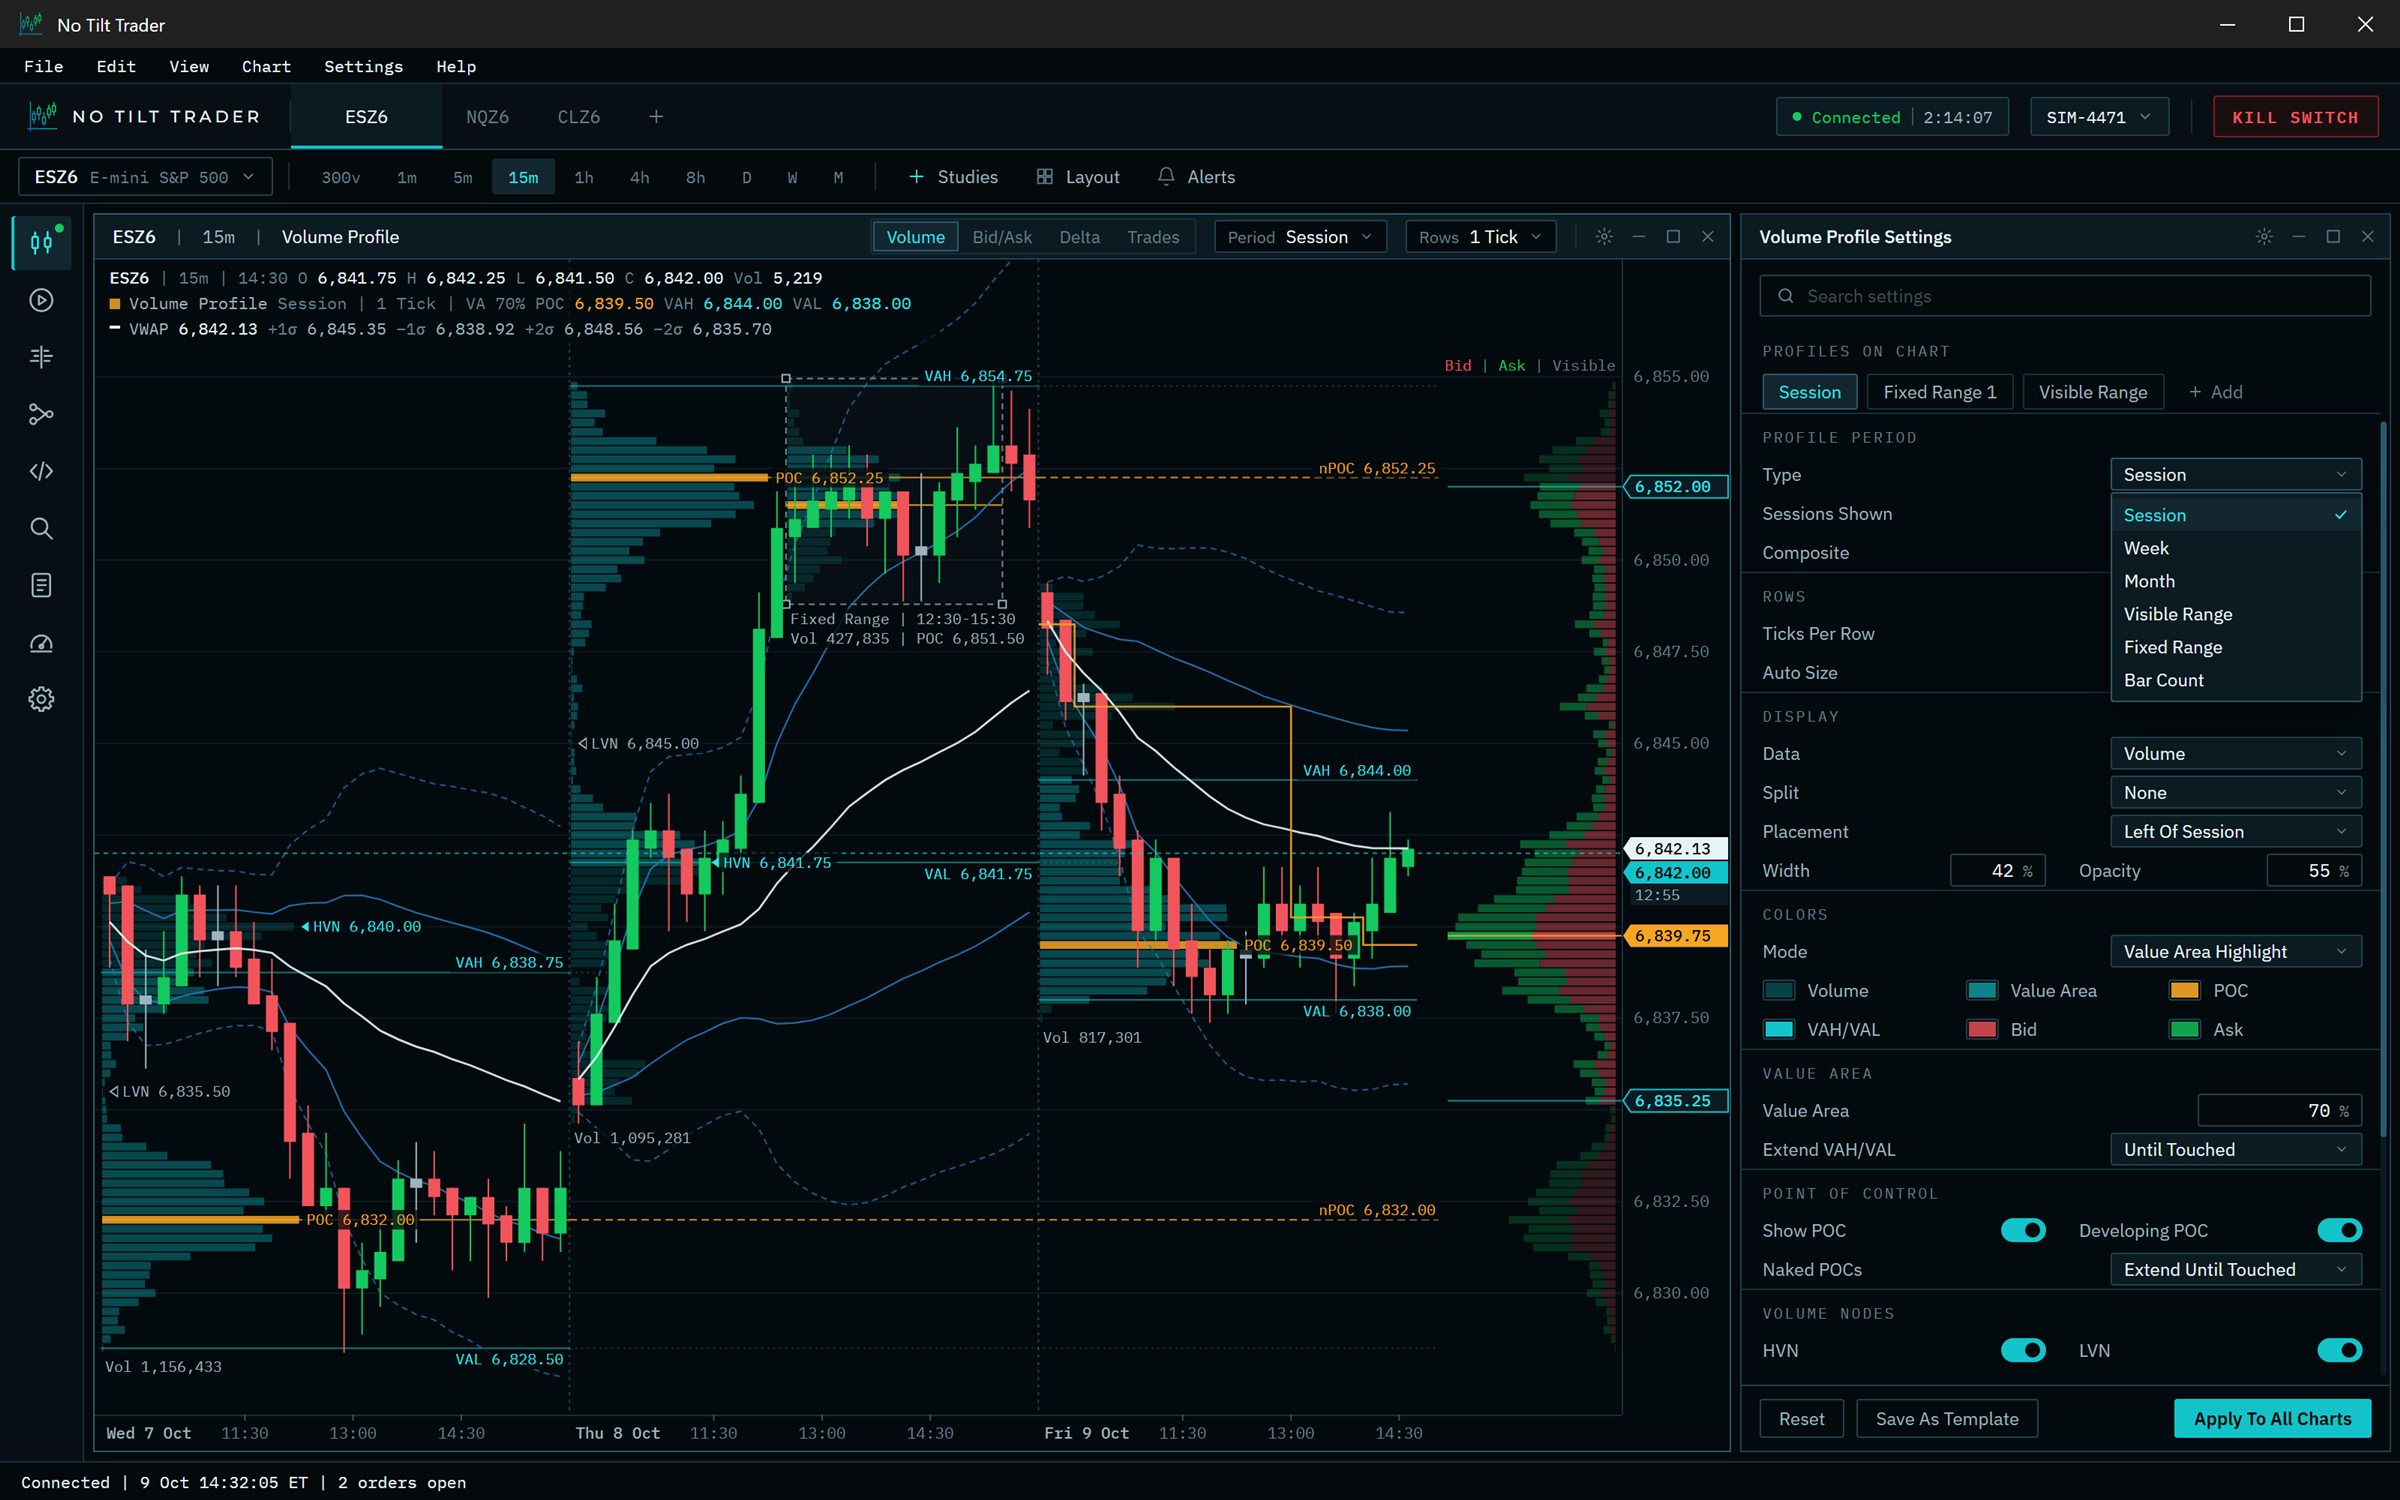
Session, weekly, monthly, visible-range and fixed-range profiles, each with its own value area and point of control.
Resting liquidity over time, with candles and executed trades overlaid and the current book on the same price scale.
Benchmark mode
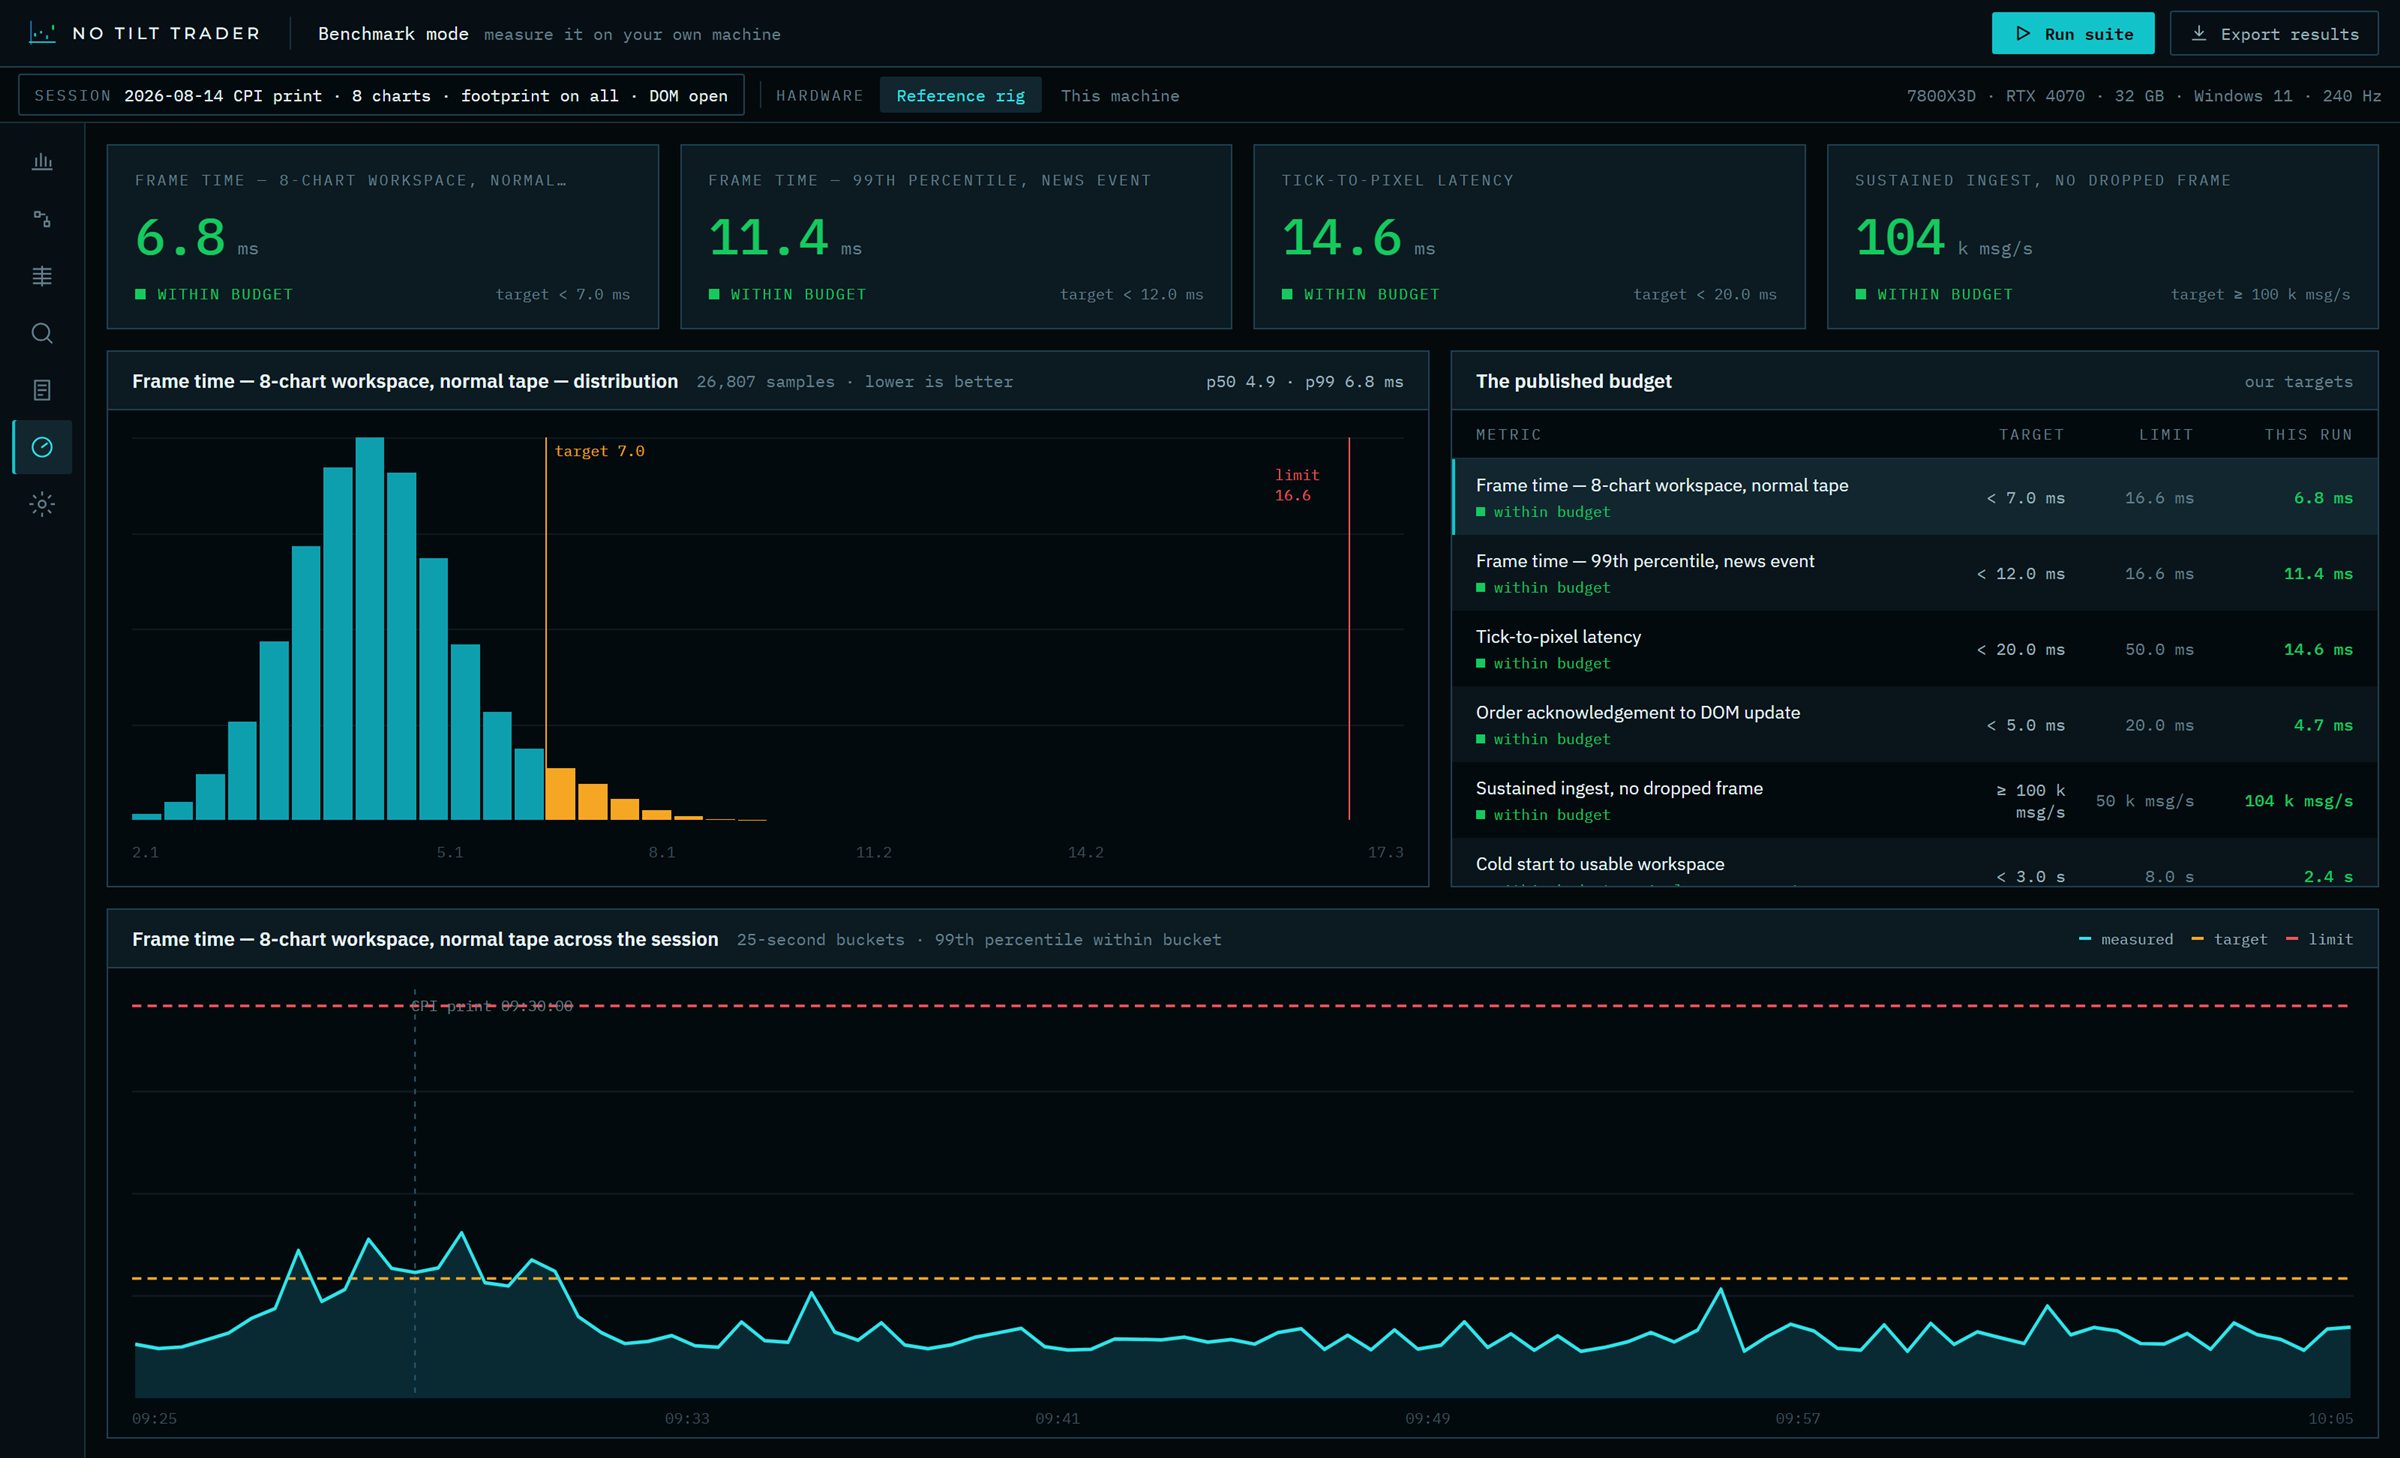
No Tilt Trader includes a benchmark mode that records how your desk performs on your own computer: how quickly every frame draws, how long a trade takes to reach the screen, and how the whole desk holds up through a news release. Run it on your own workspace, and share the results if you like.
Pricing
Market data and broker fees are billed by your provider, not by us. We don't resell market data.
Paid tiers are still being decided.
Public beta
Join the waitlist and we'll keep you posted as the beta gets closer.
No Tilt Trader is self-directed trading software. It is not a broker, an investment adviser, or a commodity trading advisor, and it does not provide trading advice, signals, managed automation, or discretionary control of any account. Trading futures and equities carries a substantial risk of loss and is not suitable for every investor. You alone are responsible for the orders you send. Market data and broker connectivity are provided under your own entitlements and your own agreements with third parties.